Phase 2: Assess Vulnerability
The content presented here is a simplified version of the Adaptation Planning Guide. For the detailed full text, download the Phase 2: Assess Vulnerability chapter.
Phase 2: Assess Vulnerability ChapterExplore resources in Adaptation Clearinghouse Database
Phase 2: Assess Vulnerability ResourcesDownload Phase 2: Assess Vulnerability templates
Download list of citations
APG EndnotesPhase 2 involves a vulnerability assessment that identifies and characterizes the climate hazards and other climate effects a community faces.
This guidance is designed to help users meet the requirements of SB 379 and SB 1035, and also easily integrate the vulnerability assessment into a local hazard mitigation plan (LHMP). This approach mostly aligns with FEMA’s risk assessment process in Task 5 of Local Mitigation Planning Handbook, and notes when this is the case. Phase 2 is more in-depth than in other planning processes in order to create a more comprehensive assessment of vulnerability to climate change effects.
Phase 2 has four steps that should be followed sequentially for completing the vulnerability assessment—exposure, sensitivity and potential impacts, adaptive capacity, and vulnerability scoring—and a final step for outreach and engagement, which can be integrated throughout or as a step at the end of this phase (see Figure 9). This phase gives a better understanding of a community’s major climate vulnerabilities, and which vulnerabilities to focus on in Phase 3.
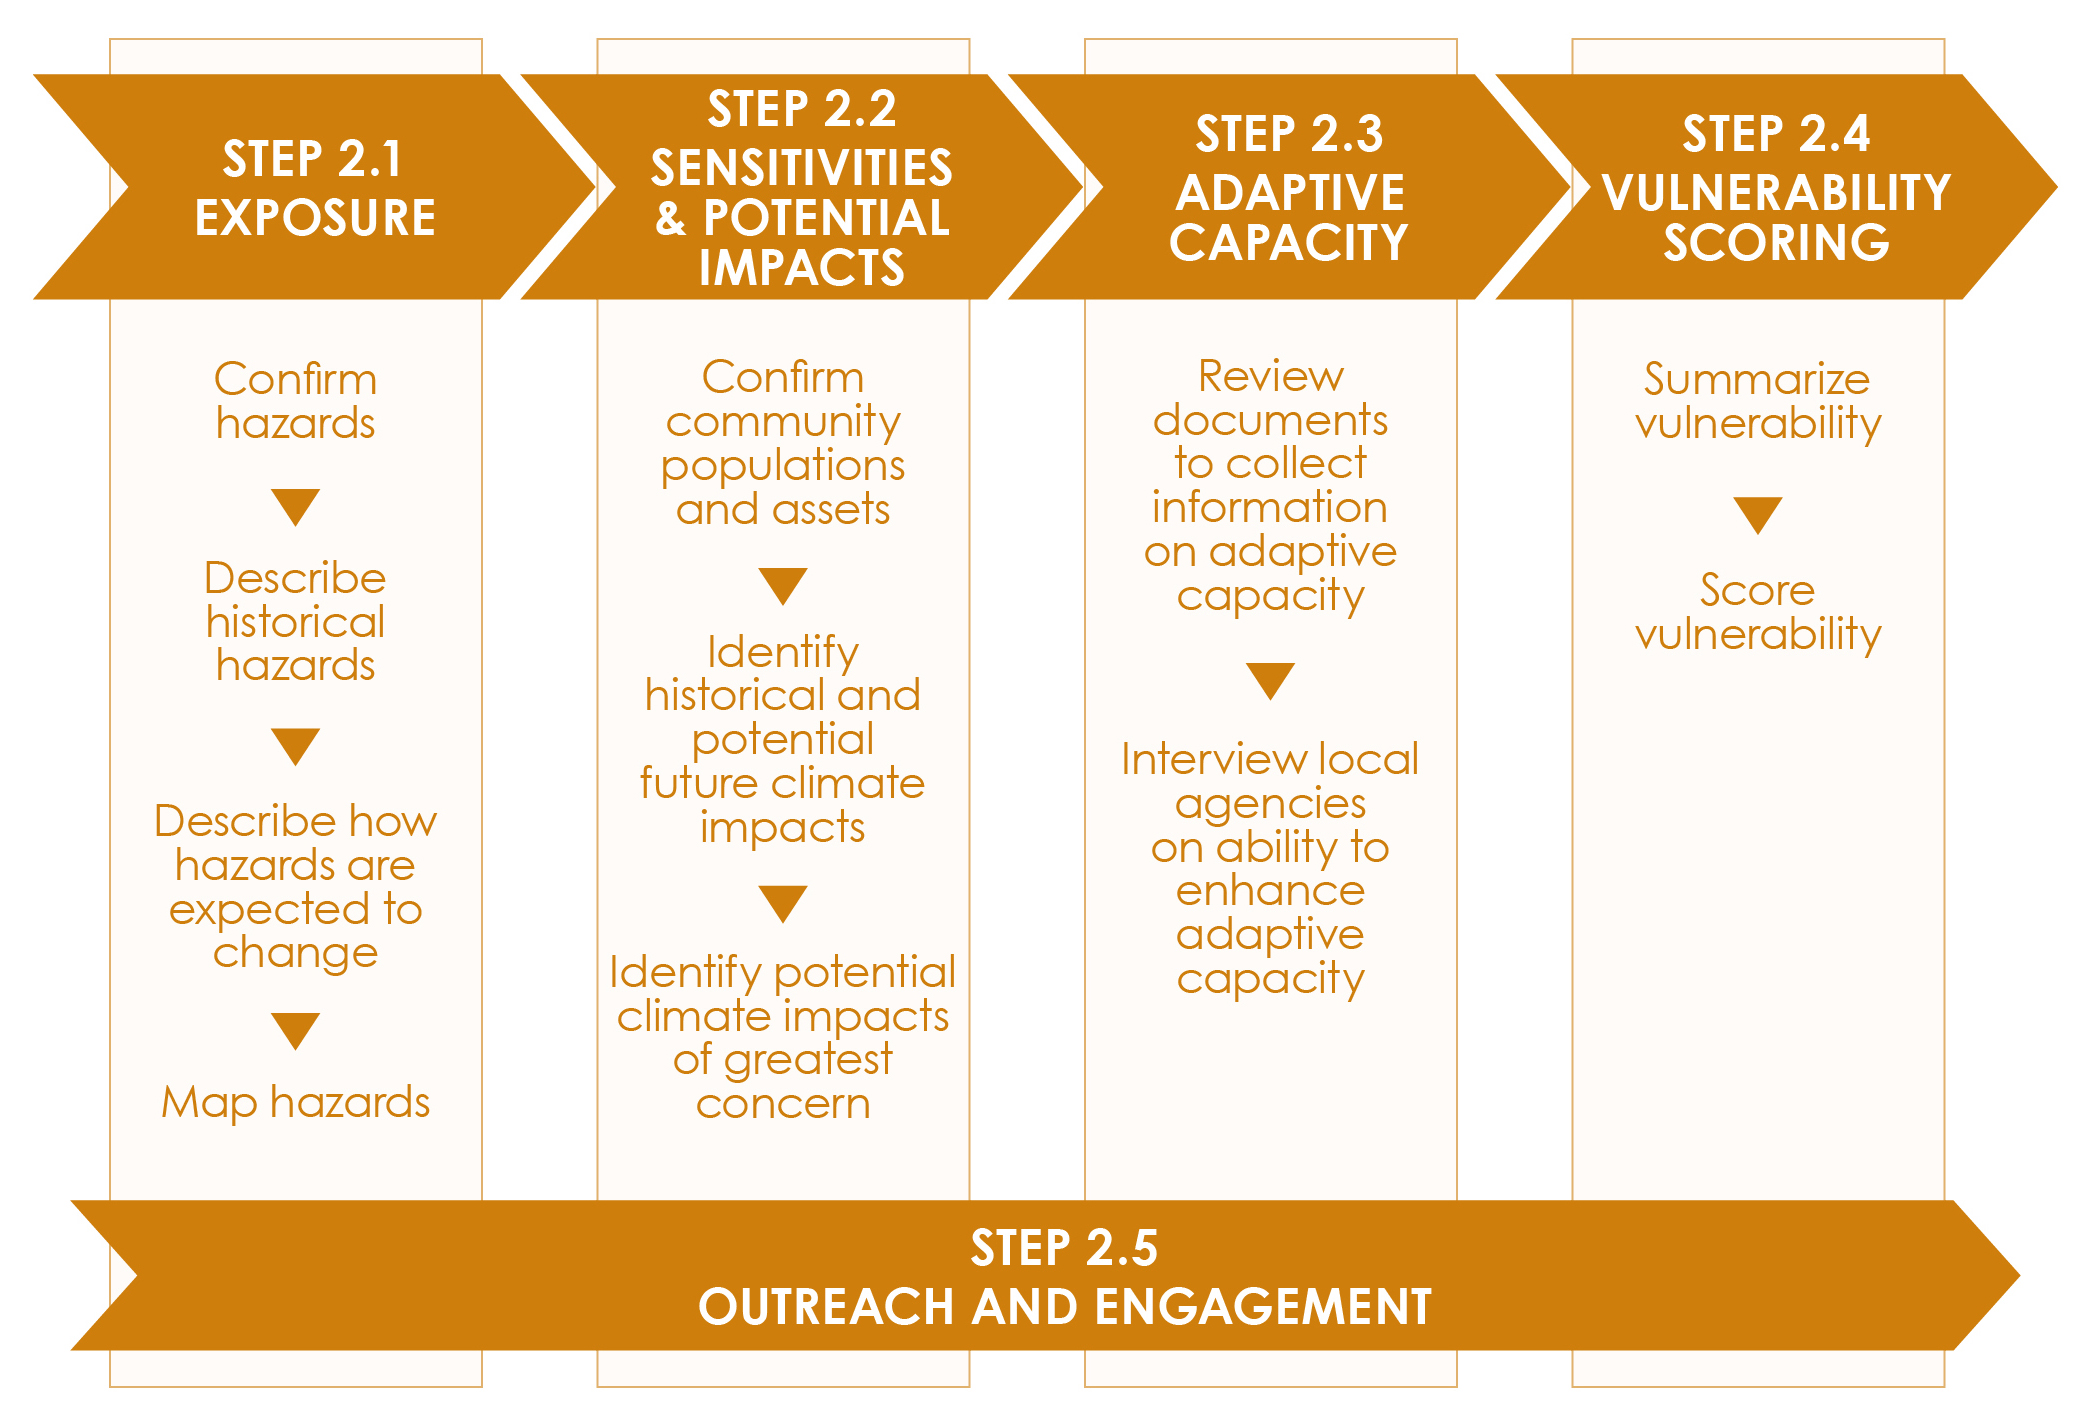
Step 2.1: Exposure
The goal of this step is to characterize the community’s exposure to current and projected climate hazards. Materials prepared for this purpose include:
- A final list of climate change effects of concern.
- An overview of major historical hazard events and the consequences to the community.
- A description of how each identified climate change effect is projected to change over the analysis period.
- Map of projected change in each identified climate change effect.
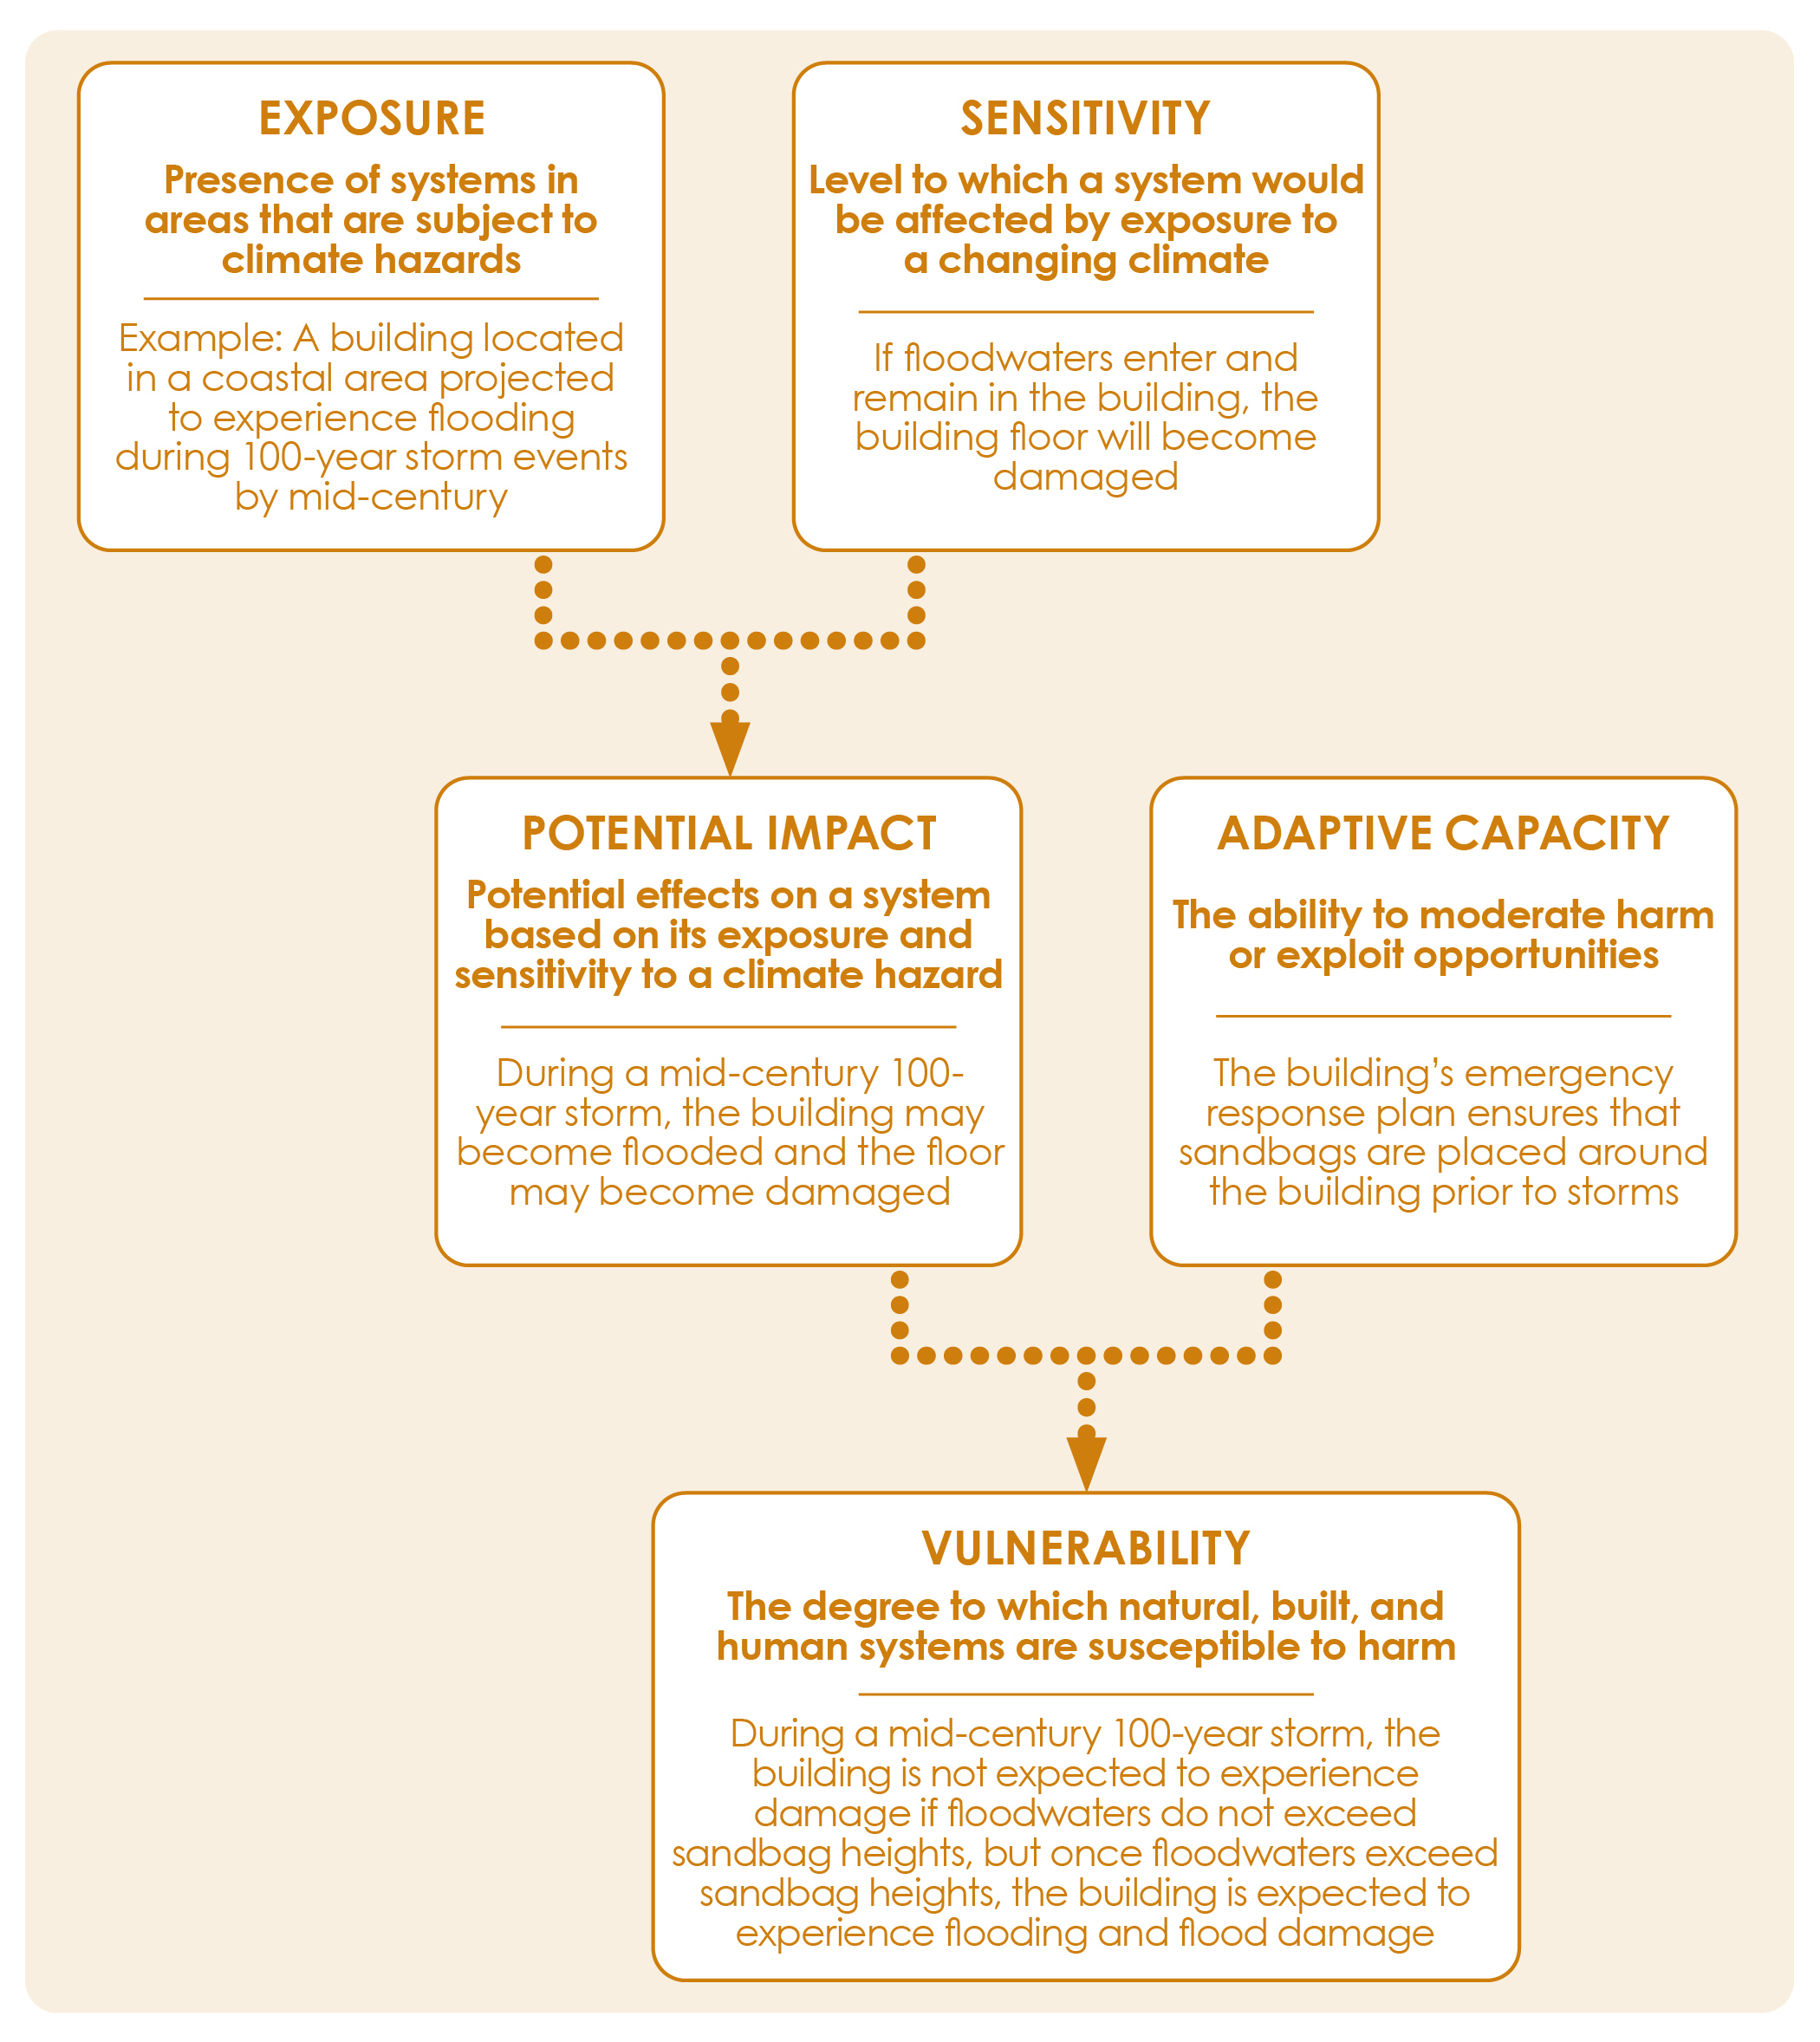
Climate change–related effects will likely change as the climate warms. The impact to a community depends in part on that community’s exposure.
Confirm hazards
Step 2.1a: Confirm hazards and other effects
Phase 1 identified a list of climate change effects. Talking to colleagues and engaging with community members can garner additional details for this list. (See Step 2.5, Outreach and Engagement, for ideas on stakeholder interviews and storytelling.) They can also validate the initial list and potentially add new effects. Tables 5 and 6 can be helpful when exploring examples of relevant climate change effects.
The regional assessments in the most recent California Climate Change Assessment have information about what effects are relevant in different communities. The different regional reports provide an overview of current and projected climate change effects throughout California and point to additional detailed studies on specific climate change effects and impacts.
Describe historical hazards
Step 2.1b: Describe historical hazards
The historical record of the hazards in a community provides context for assessing the projected changes in hazards and other climate change–related effects. It is important to describe the histories of these hazards, including when they occurred, the areas where they occurred, and their magnitude (e.g., depth of flooding, area burned, temperature). Table 8 shows an example from San Diego County’s 2017 LHMP that inventories the history of wildfires in the county.
A historical hazard inventory is a good tool for giving the community a solid context and engaging the public to gain a better understanding of broader impacts on the community. The lived experience of community members can help build support for future adaptation actions. See Step 2.5: Outreach and Engagement, for more information.
Existing documents, such as LHMPs and previous local or regional climate vulnerability assessments, may provide enough information about historical hazard trends and events to complete this step. For greater detail, whether qualitative or quantitative, consider these sources for:
- Coastal and storm hazards
- Temperature
- Precipitation and snowpack
- Drought
- Wildfires
Another helpful list of historical hazard resources for flooding and fires is in the Safety Element Completeness Checklist in OPR’s General Plan Guidelines.
Describe how hazards are expected to change
Step 2.1c: Describe how Climate hazards and other climate change effects are projected to change
Building on the historical characterization, develop projections for how each local hazard is expected to change over the identified time horizon. For each climate change effect, characterize the projected change in magnitude, frequency, seasonal timing, duration, inter-annual variability, and geographic extent.
The Step 2.1b historical inventory may reveal trends in climate hazards and other climate change effects that serve as useful context. Existing literature may also have more information about general projected trends—such as local LHMPs, previous local or regional climate vulnerability assessments, the latest California Climate Assessment, or resources in the Adaptation Clearinghouse.
Projection data is also accessible through Cal-Adapt. Cal-Adapt and other sources present a range of projection scenarios and climate models for different effects. Considering a range of scenarios and models can help staff think through variations in the severity of climate change effects and account for projection uncertainties. Data outside of Cal-Adapt may be more helpful for some climate change effects, such as information on heat-related public health rates, which can be accessed from the California Heat Assessment Tool (CHAT).
Selecting climate change projection parameters
Cal-Adapt and other resources provide climate projections for an array of greenhouse gas (GHG) emissions scenarios, climate models, and time frames. These different scenarios, models, and time frames present a wide range of results. Therefore, when retrieving projections, it is helpful to select the appropriate parameters for local circumstances.
- Selecting emission scenarios
- Regional Variations in Climate Change Effects
- Selecting climate models
- Selecting an appropriate time frame
Map hazards
Step 2.1d: Map hazards and other climate change–related effects
Mapping climate projection data helps with visualizing the populations and assets that are projected to be exposed to the effects of climate change. Depending on a community’s needs and staff capacity, some mapping options are printed maps, free computer mapping tools like Google Maps, or dedicated Geographic Information Systems (GIS).
In cases where mapping is not particularly informative, other methods for visualizing climate trends can be relevant to a community. For example, consider projecting the frequency of heat waves (i.e., multiple extreme heat days over a given threshold) over the Step 2.1c time horizons, and see how this frequency changes over time. Cal-Adapt includes a variety of visualizations to inform an exposure analysis and has downloadable data to allow visualizations in other software (e.g., Excel charts).
In some cases, quantitative datasets are not available for relevant hazards. In this case, it is still useful to provide a narrative description of how (and whether) exposure varies across the community, and the degree to which community assets are projected to be exposed. For example, although there are spatial datasets showing today’s inland flooding and landslide risks, there are not widely available spatial datasets related to future inland flooding and landslide risks. For these hazards, it is still useful to explain how risks may change in the future due to changes in climate.
For more detailed mapping, GIS data sources for climate hazard projections include:
- Coastal hazards
- Temperature, precipitation, hydrologic variables, and wildfires
If the planning team has GIS capabilities, it can overlay these climate change effect projections with community assets. Consider mapping climate change effects with utility assets, transportation assets, hospitals, telecommunication assets, public spaces, populations, and other assets. Another option is to map climate change effects with indices of social vulnerability—such as CalEnviroScreen and Healthy Places Index—to learn more about projected exposure in disadvantaged communities.
Step 2.2: Sensitivity and Potential Impacts
The goal of Step 2.2 is to characterize past and potential future climate impacts to community populations and assets. Materials produced in this step include:
- A final list of community populations and assets that are sensitive to the community’s climate change effects.
- A list of historical and potential future climate impacts to community elements.
- A list of potential climate impacts of greatest concern.
Confirm hazards
Step 2.2a: Confirm community populations and assets
Create a list of community elements exposed to the relevant climate hazards. The community elements screening in Step 1.3 of Phase 1 should be helpful with completing this step.
Depending on the outcomes of Step 2.1, consider limiting the scope to critical community elements. A broad scope of assets can dilute the focus of the vulnerability assessment and create less-actionable outcomes. A more limited scope allows more concentrated effort on later steps—such as Phase 3 and Phase 4—that focus on mitigating impacts. Revisit Phase 1 to consider the resilience goals in identifying critical community assets. These goals can help inform criteria for identification, such as a focus on enhancing safety or mitigating impacts to the community economy.
Identify historical and potential future climate impacts
Step 2.2b: Identify climate impacts to community populations and assets to determine which are sensitive to climate change effects
Projected impacts from climate hazards should be the primary concern in a vulnerability study. Climate change will exacerbate many hazards, so future climate impacts have the potential to be more severe than historical ones. Climate change will also generate impacts that may be entirely new to some communities. However, examining historical climate impacts is useful for establishing context and better understanding present-day vulnerability. As a result, in this step, consider both historical and projected impacts by collecting information on past impacts and augmenting this with more forward-looking information.
- Desk Research on Historical Climate Change Effects
- Mortality/morbidity
- Property damage
- Loss of service from critical utilities (e.g., energy, water, and wastewater).
- Disruptions to essential facilities (e.g., hospitals, schools, emergency services).
- Damage to facilities from coastal and inland flooding.
- Loss of housing (e.g., loss of areas available for housing, loss of existing limited housing stock, including affordable housing generally and specifically in communities experiencing significant housing shortages).
- Disruptions to a transportation system that can affect accessibility to some areas, or that can adversely affect drive or ride times (e.g., a landslide or flood that temporarily closes off access to an area; increased transit time on buses during precipitation events; floods or wildfires that shut down transit stops or lines).
- Impacts to local community health (e.g., number of hospital visits related to hazard events, air quality index ratings during wildfires, fatalities).
- Degradation or loss of natural assets, local ecosystems, and biological communities, including those that provide ecosystem services. For example, the Karuk Tribe Climate Change Vulnerability Assessment evaluated the impacts of high intensity fire on traditional foods and cultural use species important for health, sustenance, and well-being.
- Desk Research on Potential Future Climate Impacts
- Interview Stakeholders on Historical and Potential Future Climate Impacts
- Summarize Findings on Potential Future Climate Impacts
Building on the data and analysis from in Step 2.1b, collect information on how climate-related effects have historically impacted specific community assets and the community as a whole—for example, by reviewing existing reports and databases. Publicly available data often has impact data for specific events. For example, the EIA publishes electricity outage duration, power loss, and customers impacted as part of the Electric Power Monthly reports.6 If reports and databases are not available, stakeholders may be able to fill in historical information. Revisiting the example in Step 2.1b and Table 8, San Diego County collected information on the facilities impacted and lives lost in historical wildfire events as part of their LHMP (Table 9).
Example impacts from future climate change:
Identify potential climate effects of greatest concern
Step 2.2c: Identify potential climate effects of greatest concern
The next step is to use the research from Step 2.2b, information on community priorities gathered from Phase 1 and community engagement, and conclusions from Step 2.1 on hazards, to develop a subset of priority climate impacts that are the most important to the community.
Using the regional reports from the most recent California Climate Change Assessment can help identify the effects of greatest concern and inform the list of priority impacts.
The outcomes from Step 2.2b can also help determine which impacts pose the greatest risk.
- Consider these questions when evaluating Step 2.2b results
- Which climate impacts might result in loss of life or significant human health impacts?
- Which impacts might create disruptions or damages to essential facilities (see Phase 1, Step 1.3)?
- Which impacts might generate significant losses for the local economy?
- Which impacts may create significant environmental impacts, such as release of hazardous materials?
- Are impacts of climate change effect short but acute, long term, or both?
- Could two or more impacts interact to result in a more severe impact (e.g., wildfires followed by extreme precipitation creating landslides)?
Answering these and other questions can help identify the specific impacts that most concern a particular community, that is, the priority climate impacts, and the vulnerability assessment can move forward.
Step 2.3: Adaptive Capacity
The goal of Step 2.3 is to characterize a community’s current ability to cope with climate impacts to community populations and assets, or adaptive capacity. Materials prepared in this step:
- A matrix describing the community’s existing capacity to adapt to each of the priority climate impacts based on existing policies, plans, and/or programs.
- An enhanced version of the same matrix describing factors that enhance local agencies’ adaptive capacity.
Many communities have adaptive capacity in the form of policies, plans, programs, or institutions. Understanding this adaptive capacity entails identifying existing resources and assessing the community’s ability to cope with potential climate impacts. This information on adaptive capacity will feed into Step 2.4, Vulnerability Scoring.
Adaptive capacity focuses on existing capacity to cope. Phase 3 will focus on developing new adaptation strategies and building up future capacity to manage climate impacts.
Review documents to collect information on adaptive capacity
Step 2.3a: Review documents to collect information on adaptive capacity
The goal of this step is to identify and review documents that might outline policies, plans, or programs that already help manage climate impacts or will in the future. The information reviewed could come from local, state, regional, tribal, and federal entities, including:
- Public health and safety agencies
- Environmental regulation agencies
- Fire protection agencies
- Flood protection agencies
- Offices of emergency services
- Special districts (e.g., fire protection, sewer, sanitation, water supply, electricity, parks, recreation)
Documents produced by these agencies that may have relevant information are listed here, and many additional examples can also be found by searching in the Adaptation Clearinghouse.
A helpful way to coordinate the information in each document is to create a matrix that summarizes existing strategies and opportunities. Download a sample Adaptive Capacity Matrix template.
Interview local agencies on ability to enhance adaptive capacity
Step 2.3b: Interview local agencies on their current ability to enhance adaptive capacity
The goal of this step is to identify and interview local agencies about their adaptive capacity. The findings from Step 2.3a may help to identify local agencies that could or do affect adaptive capacity. Arrange an interview to elicit information on their existing and planned efforts to manage climate impacts now and in the future, particularly the priority climate impacts. If appropriate, this interview can be combined with the Step 2.2b interviews.
For sample interview questions and stakeholder response tracking, download these Stakeholder Interview Questionnaire and Interview Tracking templates (same templates as in Step 2.2b).
Once compiled, the findings from the interviews about adaptive capacity should be summarized in the Adaptive Capacity Matrix from Step 2.3a. These summaries can serve as a starting point for developing adaptation strategies in Phase 3.
Step 2.4b scores vulnerability, including assigning a score to adaptive capacity, but this can also be done as part of this step.
Step 2.4: Vulnerability Scoring
The goal of this step is to identify priority climate vulnerabilities based on systematic scoring. Materials prepared in this step are:
- A table summarizing vulnerabilities.
- A table showing the vulnerability score for each of the major climate vulnerabilities.
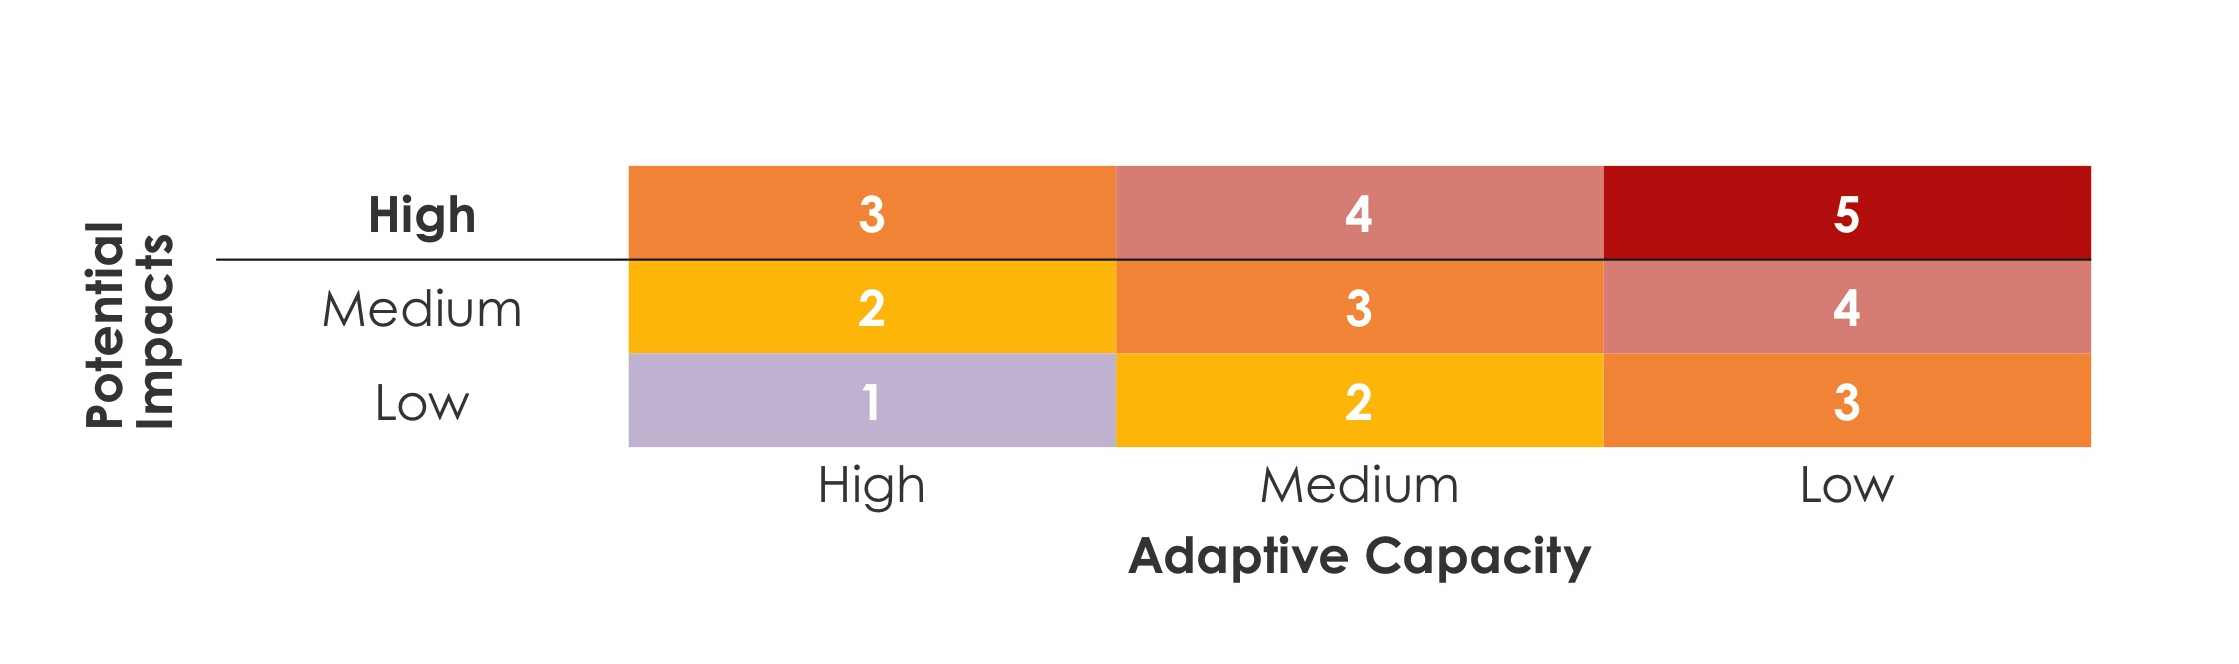
Vulnerability scores are based on the combination of potential impact and adaptive capacity and help identify the major climate vulnerabilities to address in Phase 3. The scoring process is quantitative, and the APG guidance ensures that the scoring process is transparent and can use inputs from multiple sources.
Although the APG discusses a quantitative scoring process for this step, it is possible to evaluate vulnerability in a more qualitative manner. Some organizations may find it beneficial to instead convene stakeholder groups and identify key priorities through facilitated discussion. This approach may be appropriate for situations where stakeholder input is particularly emphasized, where assessments need to be completed quickly, or where the information available is simply not conducive to a more systematic scoring approach.
Summarize vulnerability
Step 2.4a: Summarize vulnerability
For each of the climate change–related effects of concern to the community, produce a table that describes vulnerability and consequence:
- Population and community assets
- Exposure
- Sensitivity and potential impact
- Adaptive capacity
The populations and assets associated with the potential impact and its location(s) (see Step 2.2).
For a sample table, download the Summarizing and Scoring Vulnerability template.
Score vulnerability
Step 2.4b: Score vulnerability
For each population and asset at risk for each climate change–related effect described in the table from Step 2.4a, score potential impact and adaptive capacity, then use these scores to determine an overall vulnerability score. This scoring can help clarify which effects pose the greatest threats and should be prioritized in adaptation planning. For instance, in the Los Angeles County Metropolitan Transportation Authority’s Metro Climate Action and Adaptation Plan 2019, Metro scored the relevant climate change effects to identify the greatest vulnerabilities and prioritize transportation assets for adaptation actions.
To score potential impact, adaptive capacity, and vulnerability, use the example rubric, scoring matrix, and scoring table shown in Table 10, Figure 11, and Table 11 and additional tips provided in the Summarizing and Scoring Vulnerability Template and adjust the scoring system to the circumstances.
These scores will be used to determine which vulnerabilities are most pressing and should be prioritized for adaptation action in Phase 3 to help manage climate vulnerability.
Step 2.5: Outreach and Engagement
Summarize vulnerability
The goal of outreach and engagement in Phase 2 is to collaborate with community members both within the organization and externally to identify neighborhood strengths, assets, and climate change effects. Vulnerability assessments should be driven by community priorities and reflect knowledge from different population groups and neighborhoods. Outreach and engagement in this phase ensures that community members have opportunities to share their expertise and provide valuable, on-the-ground understanding of climate vulnerabilities.7
Targeted Stakeholder Interviews or Focus Groups
As noted in Step 2.2b, stakeholder interviews are important opportunities to tap local knowledge, experience, and expertise, and understand historical climate impacts.
Download Stakeholder Interview Questionnaire and Interview Tracking templates for additional support in selecting and tracking stakeholders and questions for interviews.
Storytelling Timelines
Developing a historical hazard inventory through personal narratives is an effective way to engage with the community. The lived experience of community members can create social cohesion and help build support for future adaptation actions. Create an interactive timeline with drawings, written stories, and photos as an outreach activity to learn about past climate disasters and what the responses were. Find a way to summarize best practices learned from each climate disaster and future ideas on preparing for climate change. More information on creating a storytelling timeline is in the Pacific Institute’s climate survivor workbook and in the Regional Resilience Toolkit. The Regional Resilience Toolkit offers a Storytelling Framework and Best Practices to Tell A Story.
Participatory Asset Mapping
Participatory asset mapping can help residents understand the data behind the vulnerability assessment and projections as well as give an opportunity to realize how it will impact them. Planners can present the data through visual boards and get comments through in-person workshops, and/or present the data through GIS platforms that allow residents to map their own content via their personal computers. Co-creating asset maps helps accurately capture local organizations, places, structures, or institutions that are vulnerable to climate change impacts and can support climate resilience. More information on setting up participatory asset mapping is in the Advancement Project’s Healthy City Participatory Asset Mapping.8
Community-Based Participatory Research
Partnering with an academic institution or educational nonprofit organization is another way to include students or residents as project researchers. Engage the researchers to understand the project themselves and then have them popularize technical information about local climate impacts to make it more accessible to the broader community. For example, researchers could co-create fact sheets related to natural hazards or conduct parts of the vulnerability assessments, such as interviewing several local small businesses to assess post-disaster capacity.
If funding is available, partnering with community-based organizations to do a supplemental analysis about vulnerability in lower-income communities and communities of color could be ideal. One example is Mapping Our Future: A Work Plan for Public Engagement and Equity in Climate Adaptation Planning in the San Francisco Bay Area. Based on survey results and a workshop with input from more than 400 residents, the report describes the local climate vulnerabilities based on income, race, health conditions, age, living conditions/location, occupation, language barriers, and related factors. This project was a way for community-based organizations to play a leadership role in climate adaptation planning.
When partnering with outside organizations (no matter the type), local agencies should ensure ownership of the final outputs of your project.
Phase 2 Wrap-Up
The vulnerability assessment is the process that provides participants with the details of how the community may be harmed by climate change. Through this analysis, communities can identify the most vulnerable populations and assets, and which climate-related effects may be most damaging. This can be the most technical and data-intensive phase of adaptation planning, but there are many existing reports and datasets that can help streamline the process. Community engagement during this phase can help refine the analysis and make sure it more accurately reflects specific conditions. Using the results from the vulnerability assessment, communities can develop an adaptation framework and strategies, following the process discussed in Phase 3.